Infographic Text as follows
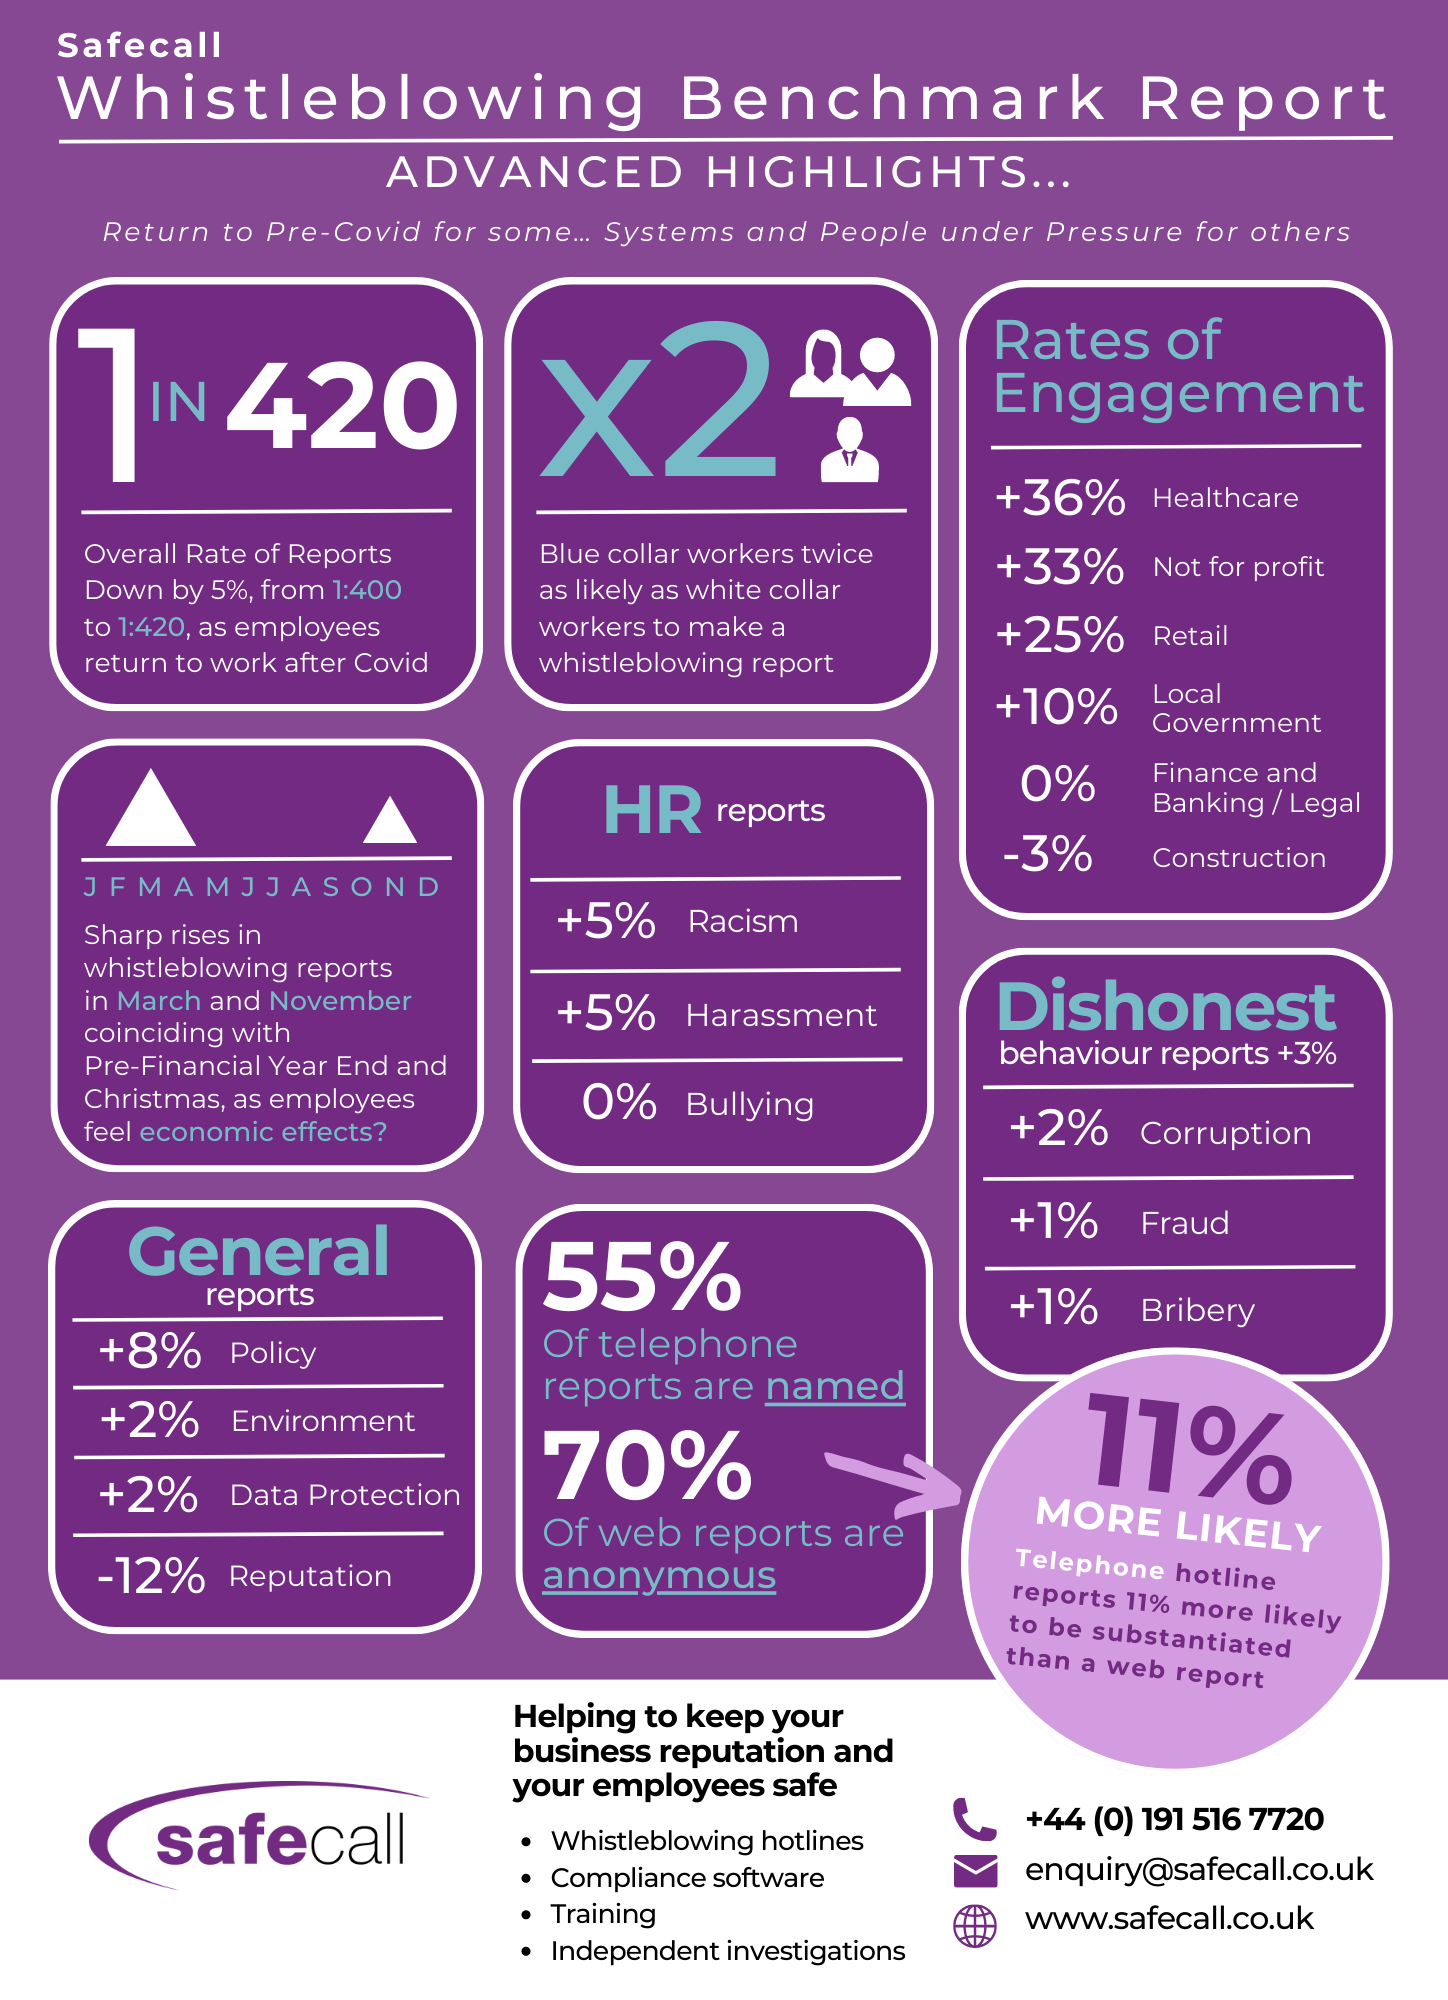
Return to Pre-Covid for some… Systems and People under Pressure for others
Overall Rate of Reports down by 5%, from 1:400 to 1:420, as employees return to work after Covid
Blue collar workers twice as likely as white collar workers to make a whistleblowing report
Rates of Engagement
+36% Healthcare
+33% Not for profit
+25% Retail
+10% Local
Government
0% Finance and
Banking / Legal
-3% Construction
Sharp rises in whistleblowing reports in March and November coinciding with Pre-Financial Year End and Christmas, as employees feel economic effects?
HR reports
+5% Harrassment
+5% Racism
0% Bullying
Dishonest Behaviour Reports +3%
+2% Corruption
+1% Fraud
+1% Bribery
General Reports
+8% Policy
+2% Environment
+2% Data Protection
-12% Reputation
55% of telephone reports are named
70% of web reports are anonymous
Telephone hotline reports are 11% more likely to be substantiated than web reports